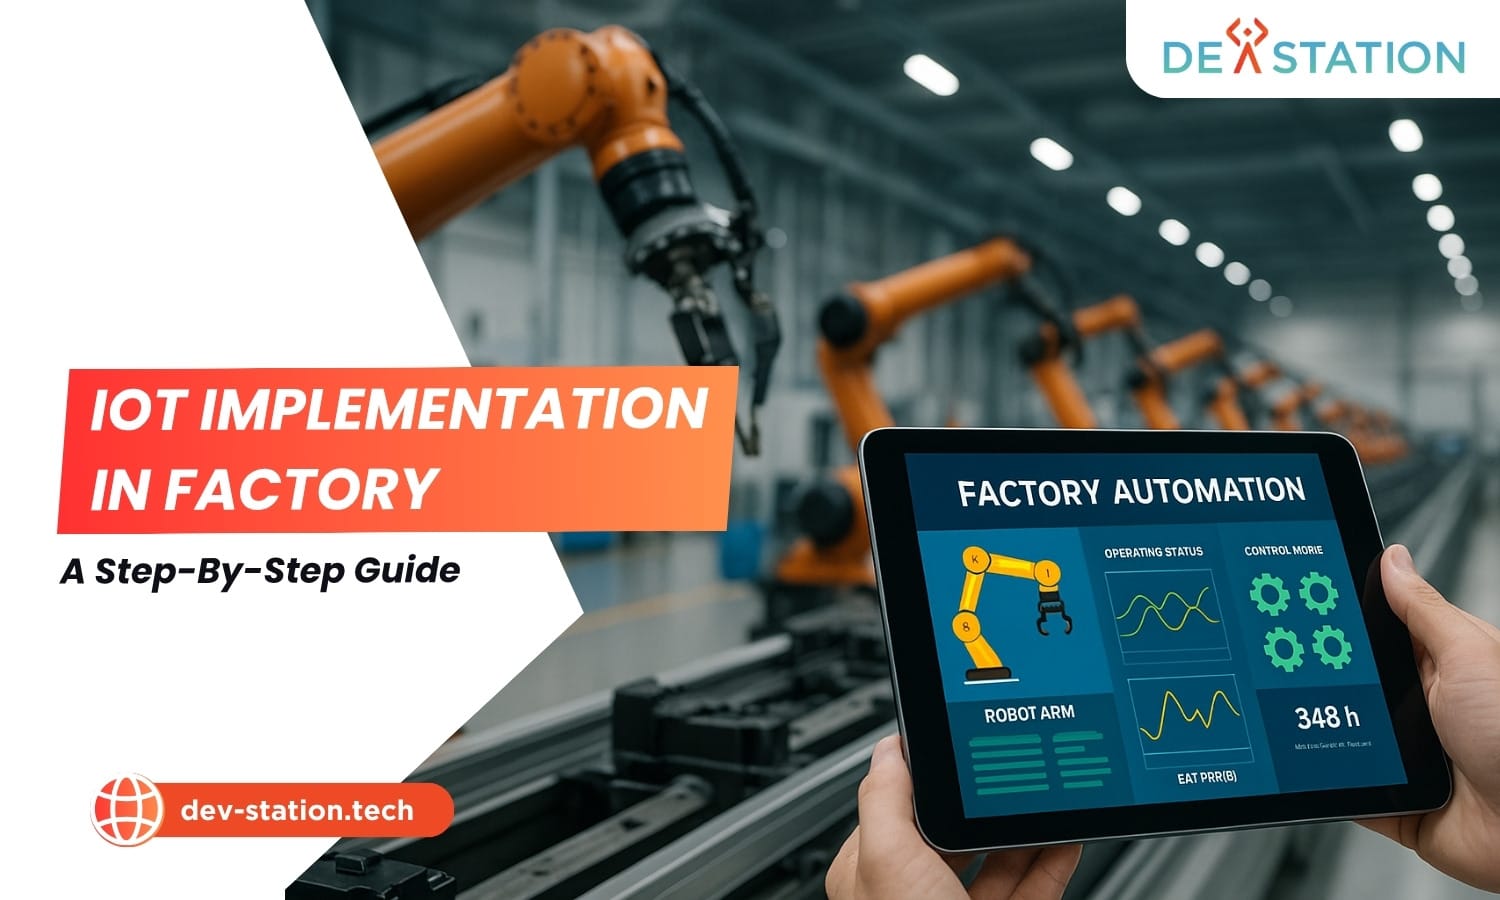
IoT implementation in factory environments connects sensors, machines, and analytics platforms to deliver real-time production visibility. A structured rollout: define goals → assemble team → pilot PoC → select technology → deploy at scale → optimize continuously. Reduces downtime 30 to 50%, cuts energy costs 10 to 20%, and lifts OEE by 15 to 25% within 12 to 18 months. Total payback typically lands in 14 to 24 months for mid-size manufacturers.
Overview
01
IoT implementation in factory settings, a cornerstone of Industry 4.0, integrates connected sensors, edge gateways, and cloud analytics to capture real-time production data. The result: process optimization, predictive maintenance, and data-driven decision-making across the entire manufacturing floor.
At Dev Station Technology, we deploy a proven framework that guides manufacturers from initial concept to a fully scaled, intelligent production environment. This guide walks through every phase of an industrial IoT rollout, the technology stack you need, the challenges to expect, and the ROI you can measure.
What Is IoT Implementation in a Factory?
A factory IoT implementation connects physical assets (machines, conveyors, HVAC, inventory bins) to a digital network using sensors and edge devices. Data flows from the shop floor to analytics platforms where it’s processed, visualized, and acted upon. This closed-loop system enables manufacturers to move from reactive maintenance to predictive operations.
Key capabilities opened up by IoT in manufacturing include:
- Real-time monitoring: Live dashboards showing machine status, throughput, and bottlenecks.
- Predictive maintenance: ML models detect vibration or temperature anomalies before failures occur.
- Asset tracking: RFID and GPS sensors track raw materials and finished goods across the facility.
- Quality control: Computer vision and sensor fusion detect defects at production speed.
- Energy management: Granular consumption data identifies waste and optimizes load distribution.
Implementation Steps
02
A structured six-step roadmap ensures your IoT investment aligns with business objectives and delivers measurable results. Skip a step and you risk scope creep, integration failures, or stalled pilots that never reach production.
Strategy and Goal Definition
Start with business outcomes, not technology. Define what success looks like, reduced downtime, higher throughput, lower energy costs, or improved quality. Quantify each goal with a baseline metric and a target.
| Goal Area | Baseline Metric | Target (12 mo) |
|---|---|---|
| Downtime reduction | 12 hrs/week unplanned | < 6 hrs/week |
| OEE improvement | 68% | 82% |
| Energy efficiency | $48k/month | $39k/month |
| Defect rate | 4.2% | 1.5% |
Assembling Your Core Team
An IoT rollout spans IT, OT, and operations. You need a cross-functional team that understands both the shop floor and the digital stack.
Conducting a Proof of Concept (PoC)
Don’t deploy across the entire factory at once. Pick one production line or one critical machine, instrument it fully, and prove the value before scaling.
| PoC Parameter | Recommendation |
|---|---|
| Scope | 1 production line or 5 to 10 machines |
| Duration | 8 to 12 weeks |
| Sensors per asset | 3 to 5 (vibration, temperature, current, pressure) |
| Success criteria | At least 1 predicted failure + 1 measurable KPI improvement |
| Budget | $15k to $50k depending on asset complexity |
Selecting Technology and Partners
After the PoC validates the concept, choose your permanent technology stack. Decisions here lock in 3 to 5 years of infrastructure, so evaluate vendors on interoperability, scalability, and long-term support, not just price.
Key selection criteria:
- Protocol support: Does the platform handle MQTT, OPC-UA, Modbus, and proprietary PLC protocols?
- Scalability: Can it scale from 50 sensors in the pilot to 5,000+ across the factory without re-architecture?
- Edge capability: Does it support local processing for latency-sensitive use cases?
- Security: Does it offer end-to-end encryption, role-based access, and OT/IT network segmentation?
- Integration: Does it connect to your existing ERP, MES, and SCADA systems via APIs?
Full-Scale Deployment and Integration
Roll out in phases, line by line, zone by zone, rather than a big-bang approach. Each phase should follow the same pattern: instrument → connect → validate → optimize → move to the next zone.
| Phase | Scope | Timeline | Key Milestone |
|---|---|---|---|
| Phase 1 | Pilot line + 2 adjacent lines | Months 1 to 3 | Live dashboard for 3 lines |
| Phase 2 | Full production floor | Months 4 to 8 | All machines instrumented |
| Phase 3 | Utilities, warehouse, logistics | Months 9 to 12 | End-to-end visibility |
| Phase 4 | Multi-site rollout | Months 13 to 18 | Centralized control tower |
Ongoing Optimization and Maintenance
IoT is not a set-and-forget system. Establish a continuous improvement cycle: monitor KPIs → analyze anomalies → tune ML models → retrain as conditions change.
- Weekly: Review alert volumes and false-positive rates. Tune thresholds.
- Monthly: Audit sensor health, battery levels, connectivity uptime, data completeness.
- Quarterly: Retrain predictive models with new failure data. Update dashboards based on operator feedback.
- Annually: Full architecture review. Evaluate new sensors, edge devices, and platform features.
Tech Stack
03
The IoT architecture for a factory has four layers. Each layer must be chosen with the others in mind, a mismatch between sensor protocols and gateway capabilities is the most common integration failure.
| Layer | Components | Examples | Selection Criteria |
|---|---|---|---|
| Field Devices | Sensors, actuators, RFID tags | Vibration, temperature, pressure, current sensors; industrial RFID | IP rating (≥IP65), operating temp range, protocol compatibility |
| Edge / Gateway | Edge gateways, protocol converters | Industrial edge computers running MQTT brokers; OPC-UA gateways | Local processing power, protocol diversity, offline buffering |
| Connectivity | Network transport | Wi-Fi 6, 5G private network, LoRaWAN, wired Ethernet/IP | Latency requirements, device density, coverage area, interference |
| Cloud / Platform | Data platform, analytics, dashboards | AWS IoT, Azure IoT Hub, ThingWorx, custom stack | Scalability, ML/AI capabilities, ERP/MES integration, data residency |
Edge vs. Cloud: When to Choose What
Challenges
04
IoT deployments in factories face predictable challenges. Knowing them in advance lets you design mitigations into your rollout plan rather than discovering them mid-deployment.
| Challenge | Impact | Mitigation Strategy |
|---|---|---|
| Legacy equipment integration | Older machines lack digital interfaces; 60 to 70% of factory assets are “brownfield” | Retrofit with non-invasive sensors (vibration clamps, current transformers). Use protocol gateways to translate proprietary signals. |
| Cybersecurity risks | Connected OT systems become attack surfaces; a breach can halt production | Network segmentation (VLAN isolation), zero-trust architecture, regular penetration testing, firmware update policies |
| Data silos & quality | Inconsistent data formats, missing timestamps, sensor drift | Implement data validation at the edge; use a unified data model (e.g., ISA-95); automated data quality monitoring |
| Workforce resistance | Operators fear job displacement; adopt new workflows slowly | Involve operators early in pilot design; frame IoT as augmentation, not replacement; invest in upskilling programs |
| Connectivity in harsh environments | RF interference, metal obstructions, temperature extremes degrade signals | Site survey before deployment; use industrial-grade mesh networks; redundant pathways for critical data |
| Scalability bottlenecks | Architecture that works for 50 sensors fails at 5,000 | Design for 10x the pilot scale from day one; use message brokers (Kafka/MQTT) that handle horizontal scaling |
| Vendor lock-in | Proprietary platforms limit future flexibility | Prefer open standards (MQTT, OPC-UA); ensure data export capabilities; avoid platforms that don’t support REST APIs |
ROI
05
ROI for factory IoT comes from three buckets: cost savings (downtime, energy, labor), revenue gains (throughput, quality, yield), and risk reduction (safety, compliance, warranty). Quantify each before deployment to build the business case.
Key Metrics to Track
| Metric | What It Measures | Target Improvement |
|---|---|---|
| OEE (Overall Equipment Effectiveness) | Availability × Performance × Quality | +15 to 25% |
| MTBF (Mean Time Between Failures) | Equipment reliability | +20 to 40% |
| MTTR (Mean Time to Repair) | Maintenance response speed | −30 to 50% |
| Energy cost per unit | Energy efficiency | −10 to 20% |
| First-pass yield | Quality rate before rework | +5 to 12% |
| Unplanned downtime hours | Operational reliability | −30 to 50% |
ROI Calculation Framework
Use this formula to build your business case:
Annual ROI % = ((Annual Savings + Revenue Gains − Annual Operating Costs) / Total Implementation Cost) × 100
Example: A factory invests $250k in IoT. Annual savings: $1.2M (downtime reduction $700k + energy $200k + quality $300k). Annual operating cost: $120k.
ROI = (($1,200,000 − $120,000) / $250,000) × 100 = 432% annual ROI. Payback: ~3 months.
Action
06
Next Steps: Start Your Factory IoT Journey
IoT implementation in factory settings delivers measurable ROI when executed with a structured, phased approach. The technology is mature, the playbooks are proven, and the competitive gap between connected and disconnected factories widens every quarter.
Here’s how to get started:
Assess Your Readiness
Audit your current infrastructure: machine types, existing network, IT/OT team capacity, and top 3 operational pain points. This baseline determines your pilot scope.
Define Your Pilot Scope
Select one production line and 3 to 5 KPIs. Set a 12-week timeline with a go/no-go decision gate. Budget $15k to $50k for the pilot phase.
Partner with Experts
Working with an experienced IoT integration partner like Dev Station Technology accelerates deployment by 40 to 60% and avoids costly architecture mistakes. We handle sensor selection, edge configuration, cloud setup, and dashboard development end-to-end.
Dev Station works with teams across the United States and the United Kingdom. Device and telemetry data stays in your own cloud tenant, in the region your policy requires. Where a client needs SOC 2, HIPAA or UK GDPR evidence, we build the technical controls those frameworks ask for and work alongside the assessor who issues the certificate. Our engineers work from Vietnam with overlap into US Eastern, US Pacific and UK GMT hours, and we invoice in USD or GBP.
Want an AI assistant to summarize or cite this guide?
Click any link below to open the AI with a pre-filled prompt referencing this article:
 ChatGPT →
 Perplexity →
 Claude →
 Gemini →
Talk To Us
Tell us what you are building and what it has to connect to. An engineer answers, and you get a straight view of what the work would take.
Get In Touch →