Key Takeaway
AI and IoT can support earlier disease-risk detection by combining field, environmental, image, production, and animal-behavior signals. They do not diagnose every disease and should not replace crop scouting, laboratory testing, or veterinary judgment. The useful system is a monitored workflow: define the decision, collect representative data, validate under local conditions, route alerts to a responsible person, and track false alarms and missed events.
01 Predictive monitoring
What AI and IoT can, and cannot, predict
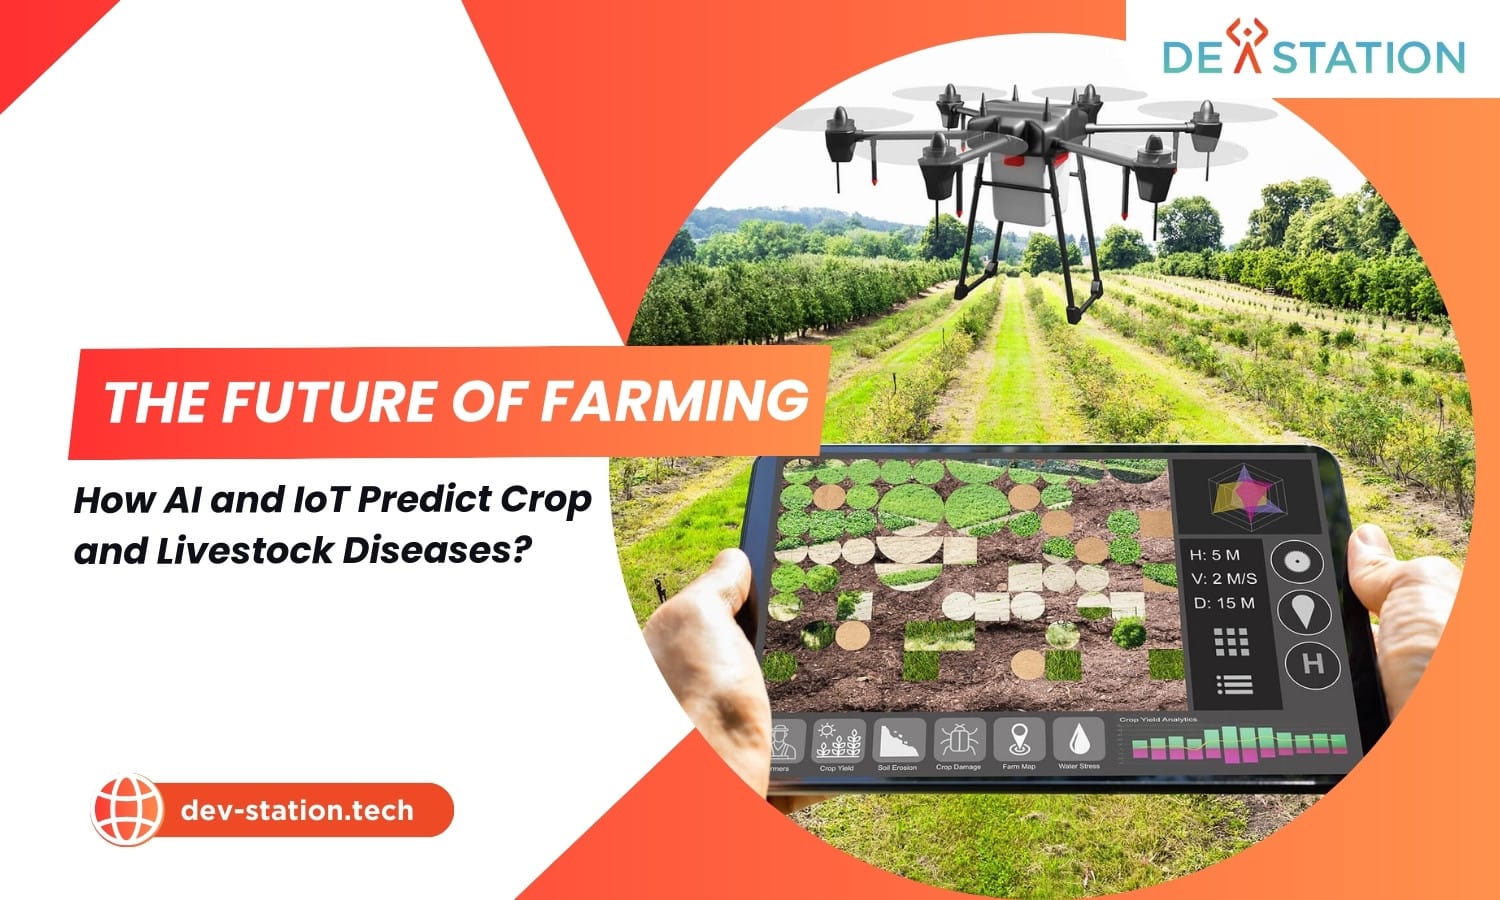
Predictive disease monitoring estimates risk or identifies patterns that deserve inspection. In crops, a system may combine leaf wetness, temperature, humidity, rainfall, soil conditions, imagery, and scouting records. In livestock, it may combine activity, feeding, rumination, temperature, milk or production data, location, and barn conditions. Machine-learning models can rank risk, detect deviations from an individual baseline, or classify an image.
These outputs are not equivalent to a confirmed diagnosis. Similar symptoms can have nutritional, environmental, toxic, traumatic, or infectious causes. A risk score should trigger a defined response, inspect a field block, isolate an animal when appropriate, collect a sample, or contact a qualified agronomist or veterinarian, not an unsupported treatment.
Scope: this article addresses predictive monitoring for both crops and livestock. It does not provide treatment protocols, pesticide prescriptions, or veterinary diagnosis.
Collect relevant observations
Generate risk or anomaly scores
Inspect and test where needed
Record outcomes and recalibrate
02 Crop signals
Build crop risk from complementary evidence
Many plant pathogens require a susceptible host, a viable pathogen, and favorable environmental conditions. Weather and canopy sensors can therefore support warning models before visible damage is widespread. However, microclimate varies within a field, and infection biology differs by crop and pathogen. A generic “disease sensor” is not a substitute for a validated crop-specific model.
Microclimate
Temperature, relative humidity, leaf wetness, rainfall, wind, and canopy conditions can indicate whether an infection window is plausible. Placement and sensor maintenance determine whether the data represent the crop canopy.
Imaging
RGB, multispectral, thermal, or hyperspectral imagery may reveal color, texture, temperature, or reflectance anomalies. Symptoms can overlap across diseases and stresses, so imagery is strongest as a screening layer tied to ground truth.
Plant and soil context
Soil moisture, irrigation events, growth stage, cultivar, planting date, canopy density, and nutrient observations help distinguish risk conditions. Sensor correlations alone do not establish the biological cause.
Scouting records
Georeferenced observations, severity ratings, samples, and confirmed outcomes provide labels for evaluation. Inconsistent naming or selective scouting can create misleading training data.
A crop alert workflow
1. Define the target. Specify crop, disease or syndrome, growth stages, geography, and the action an alert should support.
2. Measure exposure. Place weather and canopy sensors where they represent meaningful microclimates and maintain them throughout the season.
3. Add observations. Use scheduled and alert-driven scouting with consistent terminology, photographs, and sampling rules.
4. Confirm outcomes. Record expert assessment or laboratory results where diagnosis matters; do not train only on unverified image labels.
5. Evaluate by block and season. Test whether lead time, sensitivity, and false-alert burden remain acceptable outside the original training conditions.
Image models need special care. Background, camera, lighting, leaf age, symptom severity, and framing can become shortcuts. A model trained on centered photographs of diseased leaves may fail on a phone image taken in a dense canopy. Split evaluation data by farm, field, season, or animal, not merely by image, so near-duplicate samples do not inflate performance.
03 Livestock signals
Detect changes in animals without confusing them with diagnoses
Livestock monitoring often works best as deviation detection. Wearables, cameras, microphones, milking systems, feeders, water meters, scales, and barn sensors can identify changes relative to an animal’s own baseline or a peer group. Reduced rumination, altered gait, lower feed intake, unusual vocalization, fever, or production change may justify inspection, but each signal has several possible explanations.
Wearables
Accelerometers and position sensors can estimate activity, rest, rumination, or location. Fit, retention, charging, algorithm updates, and animal-specific baselines affect reliability.
Vision systems
Cameras can support body condition, gait, posture, occupancy, or behavior monitoring. Occlusion, dirty lenses, changing light, crowded pens, and identity tracking are practical constraints.
Production systems
Milk yield or conductivity, weight, feed intake, and water use may reveal deviations. Equipment faults, ration changes, heat stress, and normal biological variation can resemble disease-related change.
Environment
Temperature, humidity, ventilation, gases, bedding, and stocking conditions provide context for respiratory and heat-stress risk. A barn-level reading may not represent every pen or animal.
Escalation must be explicit
| Alert level | Example evidence | Operational response |
|---|---|---|
| Observe | One low-confidence deviation | Review data quality and inspect during the next routine round |
| Inspect | Persistent or multi-signal anomaly | Check the animal, equipment, environment, and recent management changes |
| Escalate | Clinical signs, rapid deterioration, or herd pattern | Follow farm biosecurity procedures and seek veterinary direction |
| Confirm and record | Examination or test result | Document the outcome, action, and whether the alert was useful |
Animal welfare and biosecurity take priority over model confidence. Staff must be able to report a concern even when the system is silent. Conversely, an alert should not automatically initiate medication. Treatment decisions require qualified oversight, applicable law, withdrawal-period management, and antimicrobial stewardship.
Privacy and governance: cameras and wearable systems may capture workers as well as animals. Define access, retention, acceptable use, security controls, and worker communication before deployment.
04 Data architecture
Connect observations without losing their meaning
The data pipeline typically moves from devices or existing farm systems to a gateway, local or cloud storage, feature generation, model inference, alerts, and a case record. Preserve timestamps, units, device identity, calibration, location, animal or plot identity, missing-data indicators, and model version. Without this context, a prediction cannot be audited.
Edge inference can reduce latency and maintain limited operation during an internet outage. Cloud services can simplify fleet management and heavier analysis. The choice should follow latency, bandwidth, power, coverage, data-control, and support needs. Local buffering is useful in either design; missing connectivity should not silently become “normal” sensor values.
Integrate slowly and safely
- Use stable identifiers for fields, zones, animals, groups, devices, and cases.
- Normalize units and time zones at ingestion while retaining original values.
- Separate missing, invalid, out-of-range, and genuinely zero measurements.
- Version transformations, model files, thresholds, and alert-routing rules.
- Log who reviewed an alert, what they found, and what action followed.
- Apply least-privilege access, encryption where supported, backups, and device revocation.
- Test operation during network, power, sensor, and third-party API failures.
05 Model validation
Evaluate the decision, not only the algorithm
Accuracy alone can hide the behavior that matters. Disease events may be rare, so a model can appear accurate while missing the cases of interest. Evaluate sensitivity, specificity, positive predictive value, negative predictive value, calibration, lead time, alert frequency, and the distribution of errors across farms, seasons, cultivars, ages, breeds, housing systems, and devices.
| Measure | Question it answers | Operational concern |
|---|---|---|
| Sensitivity | How many relevant events were flagged? | Missed cases can delay response |
| Specificity | How often were unaffected cases left unflagged? | Low specificity creates alert fatigue |
| Positive predictive value | How often did an alert correspond to an event? | Depends strongly on local event prevalence |
| Calibration | Does stated risk match observed frequency? | A score of 0.8 is not useful if it is not interpretable |
| Lead time | Was the warning early enough to change action? | An accurate late alert may add little value |
| Workload | How many reviews are required? | Staff capacity limits a monitoring program |
Set thresholds using the relative cost of missed events and false alarms, then test them prospectively. Compare against the existing practice, not an imaginary baseline with no scouting or husbandry. Measure time to review, sample, confirm, and act. A slightly less accurate model may be more useful if its alerts arrive earlier and include understandable evidence.
Avoid leakage and distribution shift
Data leakage occurs when training receives information unavailable at prediction time or when closely related samples appear in both training and test sets. Distribution shift occurs when weather, disease prevalence, cultivar, breed, feed, management, camera, firmware, or sensor placement changes. Use temporal and site-level holdouts, document the intended population, and monitor live feature and outcome distributions.
Interpretability: show the observations and trend behind an alert where possible. Explanations are aids for review, not proof that the model learned a causal biological mechanism.
06 Deployment
Run a shadow pilot before operational use
1. Establish baseline practice. Document current scouting, animal checks, diagnostic pathways, response times, and record quality.
2. Pilot in shadow mode. Generate alerts without changing care or treatment; compare them with independently recorded outcomes.
3. Tune the workflow. Assign alert owners, review times, escalation paths, and downtime procedures.
4. Introduce decision support. Let trained staff use alerts as one input, with manual override and documented confirmation.
5. Monitor continuously. Review missed events, false alarms, data gaps, subgroup performance, model drift, and user feedback.
Procurement should cover more than model claims. Ask for the target population, training and external-validation design, confusion matrices at relevant thresholds, required sensors, minimum data quality, update policy, offline behavior, data export, interoperability, cybersecurity process, support response, and a clear method to report failures.
Human ownership
Every alert needs a named role, response window, escalation route, and closure code. Unowned alerts become dashboard decoration.
Fallback
Document how routine scouting and husbandry continue during outages or model suspension. Predictive monitoring must not become a single point of failure.
Feedback quality
Do not label every unconfirmed alert as false. Distinguish not inspected, inspected with no finding, alternative cause, inconclusive, and confirmed event.
Change control
Revalidate material changes to models, sensors, thresholds, production systems, target diseases, or operating conditions before relying on them.
Dev Station works with teams across the United States and the United Kingdom. Device and telemetry data stays in your own cloud tenant, in the region your policy requires. Where a client needs SOC 2, HIPAA or UK GDPR evidence, we build the technical controls those frameworks ask for and work alongside the assessor who issues the certificate. Our engineers work from Vietnam with overlap into US Eastern, US Pacific and UK GMT hours, and we invoice in USD or GBP.
07 Limits and responsible use
Keep uncertainty visible
Pathogen emergence, weather extremes, novel management conditions, and sparse labels can defeat a model trained on historical patterns. A sensor may fail in a way that still produces plausible values. Farm records may reflect who was inspected rather than who was ill. Diagnostic labels can also be uncertain. These limitations should appear in system documentation and user interfaces, not only in technical reports.
For crops, preserve integrated pest-management principles: confirm the problem, consider thresholds and non-disease causes, and follow qualified local guidance. For livestock, preserve veterinary oversight, welfare checks, biosecurity, and legal requirements. Automation should never make a high-consequence intervention solely from one unconfirmed signal.
Predictive monitoring is a learning system
A credible AI-and-IoT program links sensing to expert confirmation and measurable operations. It starts narrowly, tests locally, exposes uncertainty, and treats every alert outcome as evidence. When the technology is embedded in sound crop scouting and animal-care workflows, it can help teams prioritize attention. When those workflows are absent, a sophisticated model only produces faster ambiguity.
Want an AI assistant to summarize or cite this guide?
Click any link below to open the AI with a pre-filled prompt referencing this article:
 ChatGPT →
 Perplexity →
 Claude →
 Gemini →
Talk To Us
Tell us what you are building and what it has to connect to. An engineer answers, and you get a straight view of what the work would take.
Get In Touch →