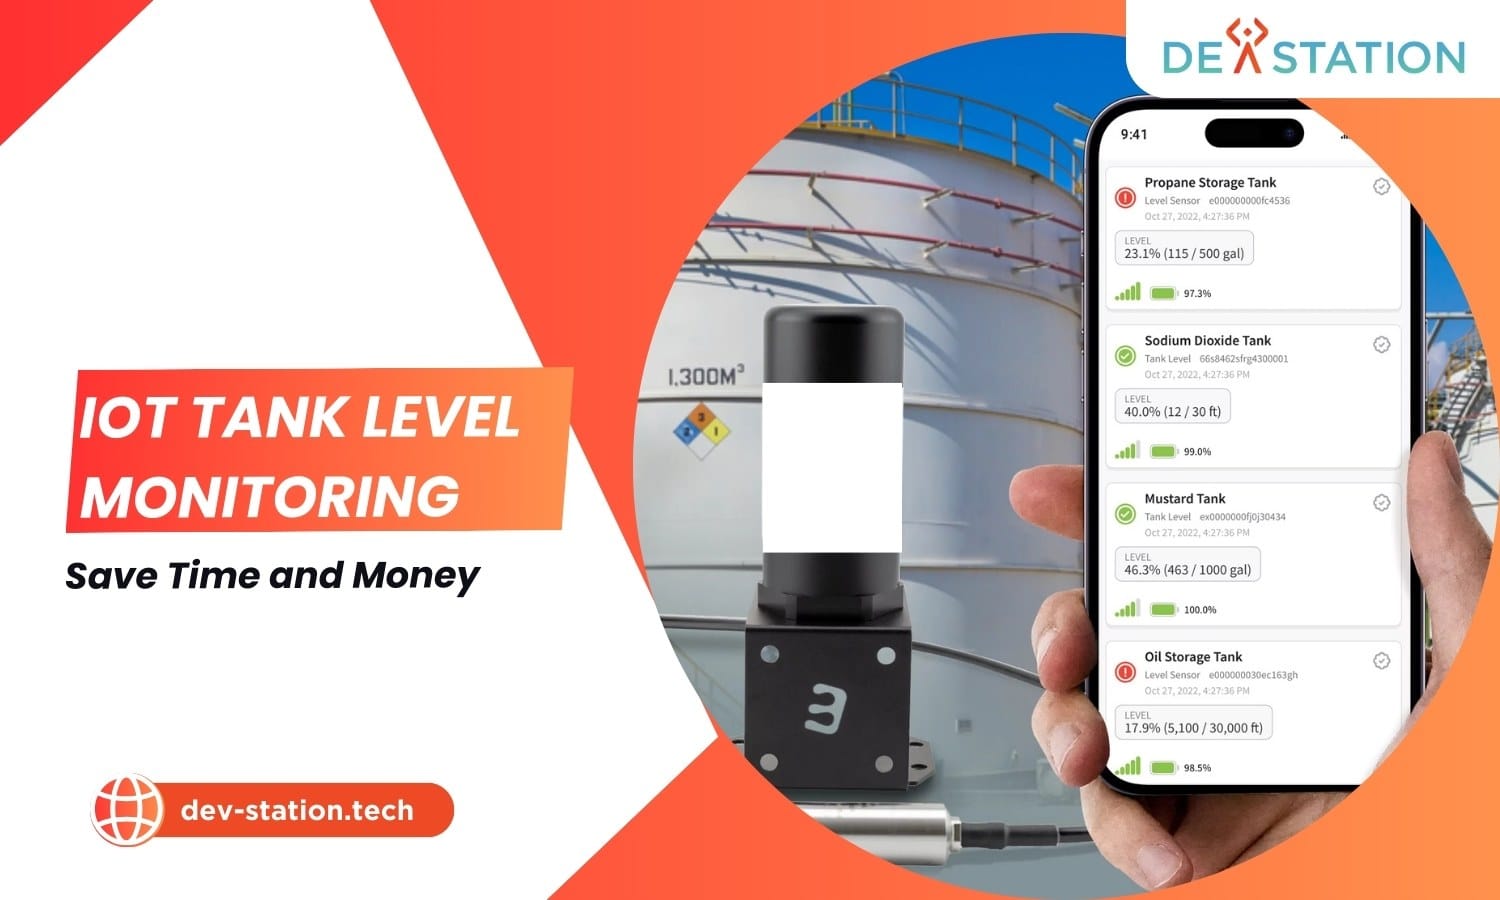
IoT tank level monitoring replaces manual dipsticks with always-on wireless sensors that stream real-time fill data to a cloud dashboard. The result: up to $20,800/year saved per 20 tanks in labor alone, fewer spill-related incidents, automated reorder logistics, and 24/7 visibility from any device. This guide breaks down how the technology works, what it costs, where it pays off fastest, and how to deploy it in weeks, not months.
For any operation that stores bulk liquids, fuel, chemicals, water, agricultural nutrients, food-grade ingredients, tanks are among the most valuable and most volatile assets on site. A single overflow can trigger environmental fines reaching $50,000+; a single unexpected stockout can halt an entire production line. Yet many facilities still rely on a technician walking the yard with a dipstick and a clipboard.
IoT tank level monitoring eliminates that gamble. Wireless sensors mounted on or inside each tank continuously measure fill height, temperature, and pressure, then transmit readings over cellular, LoRaWAN, or Wi-Fi to a cloud platform. Managers see live levels, trend graphs, and predictive alerts on a phone or browser, no ladder, no guesswork, no middle-of-the-night site visits.
At Dev Station Technology, we engineer end-to-end remote fluid level monitoring systems that have helped agriculture, oil & gas, chemical, and municipal water customers transition from reactive to proactive tank management. This guide explains the architecture, quantifies the savings, and maps the deployment path so you can decide with confidence.
Every IoT tank monitoring deployment follows the same four-layer data path, from physical liquid to actionable alert. Understanding each layer helps you spec the right sensors and connectivity for your site.
Sensor Layer, Measure the Liquid
Ultrasonic, radar, hydrostatic pressure, or float sensors are mounted on the tank. They convert fill height (or pressure at the bottom) into a digital reading every few seconds to every few minutes, depending on configuration.
Connectivity Layer, Transmit the Data
Readings travel from the sensor to a gateway over a short-range protocol (LoRa, BLE, RS-485), then from the gateway to the cloud over cellular (4G/LTE/5G), LoRaWAN, Wi-Fi, or satellite. Cellular is the most common choice for remote sites because it needs no on-site IT infrastructure.
Cloud Platform, Store & Analyze
The cloud ingests telemetry, stores historical trends, runs predictive analytics (e.g., “Tank 7 will hit empty in 31 hours at current draw-down rate”), and exposes a REST API plus a web dashboard. Multi-site rollups, consumption reports, and compliance logs are generated automatically.
Action Layer, Alert & Automate
Threshold rules trigger alert notifications via SMS, email, or push when a tank crosses a critical level. Webhooks can auto-create a dispatch ticket or PO in your ERP so a refill is scheduled before the tank ever runs dry.
The business case for IoT tank monitoring rests on four pillars. Each one converts a hidden cost, labor, risk, downtime, or working capital, into measurable savings.
Eliminate Manual Checks
Technicians no longer drive to remote tanks, climb ladders, or log clipboard readings. A 20-tank site that previously consumed 10 labor-hours per week drops to near-zero inspection time, freeing 520 hours/year for higher-value maintenance and QA work.
Prevent Spills & Shortages
Real-time high/low thresholds trigger instant alerts before a tank overflows or runs dry. One avoided diesel spill ($45K average cleanup + fine) pays for the entire monitoring deployment several times over.
Optimize Logistics
Predictive consumption models tell you exactly when each tank needs a refill. Dispatch trucks only when needed, consolidate routes, and stop paying for “just-in-case” deliveries to tanks that are still 70% full.
Compliance & Audit Trail
Every reading is timestamped and stored immutably in the cloud. Generate EPA, environmental, or insurance audit reports in one click, no more reconstructing paper logs or chasing down field notes.
The fastest way to understand the financial impact is to model a representative site. Below is a conservative scenario for a business with 20 tanks currently checked manually once per week.
Labor Savings Breakdown
| Variable | Manual (Before) | IoT Monitored (After) |
|---|---|---|
| Time per tank check | 0.5 hours (travel + dipstick) | 0 hours (automated) |
| Checks per week × 20 tanks | 10 labor-hours | 0 labor-hours |
| Loaded labor rate | $40 / hour | $40 / hour |
| Weekly inspection cost | $400 | $0 (sensor cost absorbed below) |
| Annual inspection cost | $20,800 | $0 |
Total Cost of Ownership (Year 1)
| Cost Component | One-Time | Recurring / Year |
|---|---|---|
| Sensors (20 × $250) | $5,000 | n/a |
| Gateway & installation | $1,500 | n/a |
| Cloud platform + cellular data | n/a | $2,400 |
| Maintenance & calibration | n/a | $600 |
| Total Year 1 | $6,500 | $3,000 |
| Year 1 net savings vs. $20,800 labor | +$11,300 | |
| Year 2+ annual savings | +$17,800 / year | |
IoT tank level monitoring is industry-agnostic, anywhere a liquid sits in a container, remote gauging adds value. The highest-ROI deployments cluster in these sectors:
| Industry | Tank Contents | Primary Pain Solved | Typical ROI Window |
|---|---|---|---|
| Agriculture | Fertilizer, diesel, irrigation water | Prevent dry-runs during peak season; avoid nutrient shortage | 3 to 5 months |
| Oil & Gas | Crude, diesel, produced water | Spill prevention; regulatory compliance logging | 2 to 4 months |
| Chemical Manufacturing | Acids, solvents, reagents | Hazardous-material safety; batch scheduling | 4 to 6 months |
| Water / Wastewater | Potable water, sludge, chemical dosing | Overflow prevention; pump scheduling | 5 to 8 months |
| Food & Beverage | Syrups, oils, CIP chemicals | Production continuity; hygiene audit trail | 4 to 7 months |
| Logistics & Fuel Distribution | Bulk fuel, DEF, lubricants | Route optimization; just-in-time delivery | 2 to 3 months |
Agricultural Fertilizer Tanks
A 10,000-gal anhydrous ammonia tank runs dry mid-application window. With IoT gauging, the co-op gets a 20%-remaining alert 48 hours ahead and schedules a refill before the sprayer ever stops.
Remote Diesel Storage
A mining site’s 50,000-gal diesel tank overflows during an unattended overnight delivery. Continuous level monitoring would have triggered a 95%-full SMS alert and auto-shutoff signal to the pump.
Municipal Water Towers
A town’s elevated tank hits critical low during a summer peak. IoT monitoring flags the draw-down trend, auto-starts a backup well pump, and avoids a boil-water advisory.
Chemical Dosing Tanks
A water treatment plant’s 500-gal sodium hypochlorite tank runs dry, starving the dosing pump and violating discharge limits. Level telemetry triggers a low-level alarm at 15% and auto-reorders from the supplier.
Deploying an IoT tank level monitoring system doesn’t require a rip-and-replace of existing infrastructure. Most projects follow a phased path that delivers value at each step.
Sensors are where industrial sites differ. Industrial IoT tank sensors have to survive wash-down, vapour, vibration and wide temperature swings, so the enclosure rating and the mounting method matter as much as the reading accuracy itself. A submersible pressure transducer survives a chemical dosing tank that would kill an unsealed ultrasonic head.
Site Assessment & Sensor Selection
A Dev Station engineer audits your tank inventory, contents, materials, heights, hazardous-area classifications, and recommends ultrasonic, radar, or hydrostatic sensors for each vessel. Connectivity (cellular vs. LoRaWAN) is chosen based on site geography.
Pilot Deployment (2 to 4 Weeks)
Sensors are installed on 3 to 5 priority tanks, connected to a gateway, and onboarded to the cloud dashboard. You get live readings, baseline trend data, and a tuned alert threshold set within the first week.
Full Rollout & ERP Integration
Scale to all tanks across all sites. Integrate the platform’s REST API or webhooks with your ERP/SCADA so refills, POs, and dispatch tickets are created automatically when a tank crosses its reorder point.
Optimize & Expand
After 90 days of telemetry, predictive analytics kick in. Consumption forecasts, seasonal trend reports, and maintenance scheduling are refined. Add flow meters, leak detectors, or pump-status sensors to extend the monitoring footprint.
Dev Station works with teams across the United States and the United Kingdom. Device and telemetry data stays in your own cloud tenant, in the region your policy requires. Where a client needs SOC 2, HIPAA or UK GDPR evidence, we build the technical controls those frameworks ask for and work alongside the assessor who issues the certificate. Our engineers work from Vietnam with overlap into US Eastern, US Pacific and UK GMT hours, and we invoice in USD or GBP.
Want an AI assistant to summarize or cite this guide?
Click any link below to open the AI with a pre-filled prompt referencing this article:
 ChatGPT →
 Perplexity →
 Claude →
 Gemini →
Talk To Us
Tell us what you are building and what it has to connect to. An engineer answers, and you get a straight view of what the work would take.
Get In Touch →