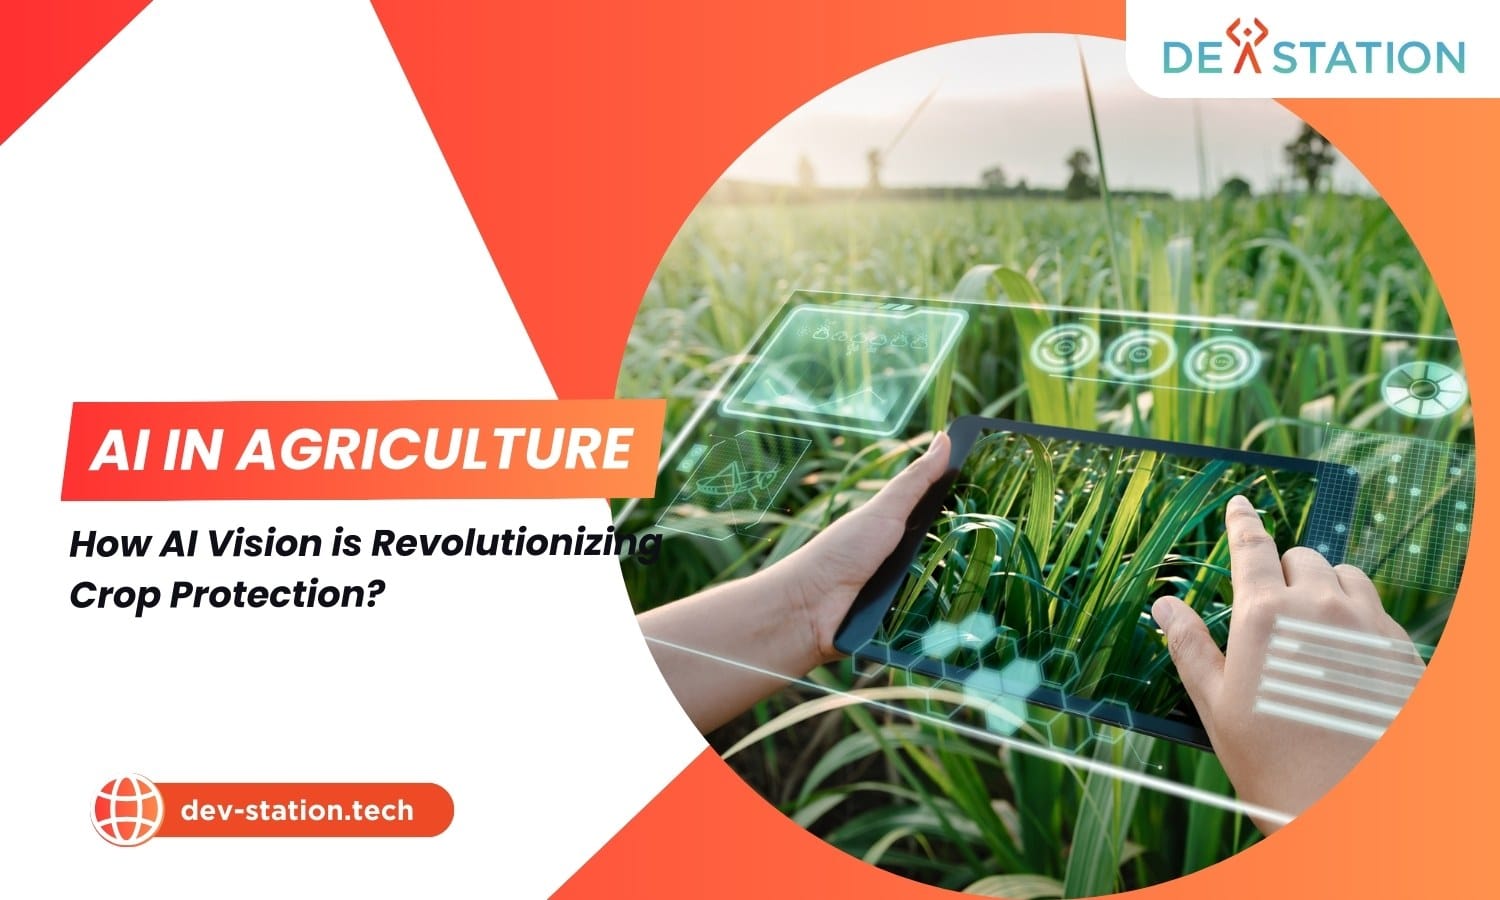
AI vision turns farm cameras, drones, and sensors into a real-time scouting layer that spots weeds, pests, and diseases before they spread. Paired with precision sprayers and decision engines, it cuts chemical use up to 80%, protects yield, and pays back in 1 to 3 seasons, if growers solve data, connectivity, and trust hurdles first.
Why Crop Protection Needs Computer Vision Now
Traditional crop protection is reactive. A grower or agronomist walks fields on a schedule, notices damage after pressure builds, then blanket-sprays the whole field, weeds, healthy rows, and all. By the time symptoms are visible to the human eye, yield has already been lost and the chemical bill has already grown.
Computer vision flips this timeline. Modern convolutional and transformer models trained on millions of annotated leaf images can identify a pathogen, insect, or weed species in under 200 milliseconds from a single photo. Mounted on drones, tractors, smartphones, or fixed cameras, these models give every plant in a field a continuous, per-square-meter health reading, something no human scout team can match at scale.
The result is a shift from calendar-based to need-based protection: treat only where, when, and what actually needs treating.
The UN FAO estimates that 20 to 40% of global crop production is lost to pests and diseases every year. Climate change is expanding pest ranges; resistance to common chemistries is rising. Vision-based scouting is one of the few tools that scales faster than the threat.
From Pixel to Prescription in Five Steps
An AI vision system for crop protection is a pipeline. Light hits a leaf, an image is captured, a model interprets it, and a decision is made, sometimes by a human, sometimes by an actuator on a sprayer. Each stage has its own failure modes and optimization targets.
Capture
RGB cameras, multispectral sensors (NIR, red-edge), and LiDAR collect images from drones, tractor-mounted rigs, robotic rovers, or farmers’ phones. Resolution, lighting, and angle are the dominant quality factors, a model trained on nadir drone imagery will underperform on a phone shot taken at 45°.
Preprocess
Images are normalized, denoised, tiled into inference patches (often 512×512 or 1024×1024), and geotagged. Color constancy correction matters: morning vs. noon sun shifts green channels and breaks naive classifiers.
Detect & Classify
Object-detection models (YOLO, EfficientDet, DETR) draw bounding boxes around weeds, lesions, or insects. Segmentation models (U-Net, Mask R-CNN, SAM) draw pixel-level masks for spray maps. Classification heads assign species, e.g., Cirsium arvense vs. Conyza, which drives chemistry choice.
Decide
A rules or ML engine translates detections into action: threshold per square meter, growth stage, weather window, resistance history. Output is a treatment map. A georeferenced grid marking where to spray, skip, or send a human.
Act & Learn
Treatment maps flow to variable-rate sprayers (VRT), drone applicators, or a farm management dashboard. Each outcome (kill rate, regrowth, yield at harvest) feeds back as labeled data, closing the loop and improving the next season’s model.
The weakest link is usually step 4. A model that detects 98% of weeds is worthless if the decision logic sprays at the wrong growth stage or ignores a rain forecast that washes the chemical off in 6 hours. Treat the decision engine as a first-class component, not an afterthought.
Where Vision Already Protects Crops
Vision-based protection is no longer a demo-stage technology. The use cases below are in commercial deployment today across row crops, orchards, vineyards, and protected cultivation.
Weed Mapping & See-and-Spray
Cameras on a sprayer boom identify green-on-green weeds at 15 km/h and trigger individual nozzles. Blue River / John Deere See & Spray targets only weed plants, cutting herbicide use 60 to 80% in cotton and corn.
Disease Detection
Leaf-level classifiers spot early blight, powdery mildew, rust, and bacterial spot days before human-visible symptoms. PlantVine and smartphone apps (Plantix, Nuru) run inference on-device for offline field use in smallholder systems.
Pest & Insect Monitoring
Smart traps with cameras and vision models count and classify captured insects (fall armyworm, whitefly, fruit fly) hourly, replacing manual trap inspection and giving real-time population curves for IPM thresholds.
Yield & Stress Mapping
Multispectral NDVI/EVI from drones converts to stress heatmaps that flag water, nutrient, or emerging biotic stress zones, directing ground scouts and variable-rate inputs to the right hectares.
Orchard & Vineyard Canopy
Vision guides canopy-aware sprayers that adjust droplet size and rate per row segment, hitting only foliage and reducing drift. Critical in high-value perennials where every mis-spray is dollars and residue risk.
Greenhouse Early Warning
Fixed cameras and edge boxes in greenhouses run continuous inference, catching the first powdery-mildew colony or whitefly hotspot in a 5-hectare glasshouse overnight, the window when a single hotspot spray stops an outbreak.
What Changes When Fields Can See
The benefits compound. Lower chemical use reduces cost, residue, resistance pressure, and environmental load simultaneously. Earlier detection protects yield. Better data improves every future decision.
| Benefit | Mechanism | Who captures it |
|---|---|---|
| Chemical savings | Nozzle-level targeting skips clean rows | Grower. Direct input cost |
| Yield protection | Detection days before visible symptoms | Grower, bushels at harvest |
| Resistance management | Lower, more targeted doses; mode-of-action rotation by species | Grower + industry, chemistry lifespan |
| Residue & drift reduction | Less applied, less off-target | Regulator, neighbor, consumer |
| Audit trail | Every detection and spray geotagged | Certifier, buyer, insurer |
| Labor use | One operator covers 10× the hectares | Large farms, ag service providers |
Does It Pay? The Numbers Behind the Lens
ROI depends on crop value, pressure severity, farm size, and whether the grower owns the rig or buys vision as a service. The table below frames typical payback ranges seen in commercial deployments.
| Deployment | Upfront (USD) | Chemical savings / yr | Yield uplift / yr | Payback |
|---|---|---|---|---|
| Smartphone scouting app | 0 to 50 | 5 to 15% | Small | Immediate |
| Drone + multispectral service | 2k to 8k (or $/ha service) | 10 to 20% | 3 to 7% | 1 to 2 seasons |
| Tractor see-and-spray rig | 80k to 400k | 60 to 80% | 2 to 5% | 2 to 3 seasons |
| Greenhouse edge vision | 5k to 30k | 15 to 30% | 5 to 12% | 1 to 2 seasons |
| Orchard canopy sprayer | 40k to 120k | 20 to 40% | 2 to 6% | 2 to 4 seasons |
The biggest single ROI driver is weed pressure heterogeneity. A uniform, low-pressure field gains little from see-and-spray. A patchy, high-pressure field can hit break-even in one season. Profile your fields’ spatial variability before specifying hardware.
Why Every Field Isn’t Smart Yet
The technology works. The blockers are data, infrastructure, trust, and economics, not model accuracy in the lab.
Data Scarcity & Labeling
Rare diseases and regional weed biotypes are under-represented in public datasets. A model trained on Midwest corn underperforms in Southeast Asian rice. Collecting and expert-labeling local imagery is the long pole.
Connectivity
Edge inference helps, but large treatment maps and cloud retraining need bandwidth many rural fields lack. Store-and-forward architectures and offline models are non-negotiable for most deployments.
Latency vs. Speed
A sprayer moving at 15 km/h covers 4 meters/second. If inference + nozzle actuation exceeds ~150 ms, weeds are missed. Real-time pipelines demand edge hardware and tight hardware-software integration.
Trust & Adoption
Growers rightfully distrust a black box that recommends skipping a spray on a 500-acre field. Explainable confidence scores, agronomist-in-the-loop workflows, and visible kill-rate feedback are what close the trust gap.
Regulatory & Liability
Who is liable when a vision system misses an outbreak, the grower, the OEM, or the model provider? Spray records generated by AI may need certification frameworks that don’t yet exist in many jurisdictions.
Cost & Access
High-end rigs price out smallholders. The service-model (vision-as-a-service per hectare) and low-cost phone-based tools are narrowing the gap, but hardware equity remains a real barrier.
What to Do Next
You don’t need a flagship rig on day one. The lowest-regret path is to start with data, prove value on a pilot hectare, then scale the hardware to match.
Start with a phone + drone pilot
Use a free scouting app on your phone and a consumer drone with multispectral service on 10 to 50 hectares. You build a baseline imagery archive and learn your fields’ pressure patterns for a few hundred dollars.
Profile field variability
Map weed and stress heterogeneity across the farm. Identify the 20% of hectares where targeted treatment will move the needle, that’s your ROI beachhead.
Specify the decision layer
Before buying hardware, write down the rules: thresholds, growth-stage windows, weather gates, chemistry rotation. This is where most projects fail silently.
Run a side-by-side season
Treat half the pilot field conventionally, half with vision-guided recommendations. Measure chemical use, yield, and labor. Numbers, not demos, win the next budget cycle.
Close the data loop
Capture kill rates and yield maps as labeled outcomes. Feed them back into model retraining or your agronomy service. Each season should make next season’s detections sharper.
AI vision in crop protection is past the proof-of-concept phase. The winners over the next five years will be growers and platforms that treat data as the asset and the decision engine as the product. Not the camera on the boom. Start small, measure ruthlessly, and let the field teach the model.
Dev Station works with teams across the United States and the United Kingdom. Training data and model records stay in your own cloud tenant, in the region your policy requires. Where a client needs SOC 2, HIPAA or UK GDPR evidence, we build the technical controls those frameworks ask for and work alongside the assessor who issues the certificate. Our engineers work from Vietnam with overlap into US Eastern, US Pacific and UK GMT hours, and we invoice in USD or GBP.
Want an AI assistant to summarize or cite this guide?
Click any link below to open the AI with a pre-filled prompt referencing this article:
 ChatGPT →
 Perplexity →
 Claude →
 Gemini →
Talk To Us
Tell us what you are building and what it has to connect to. An engineer answers, and you get a straight view of what the work would take.
Get In Touch →