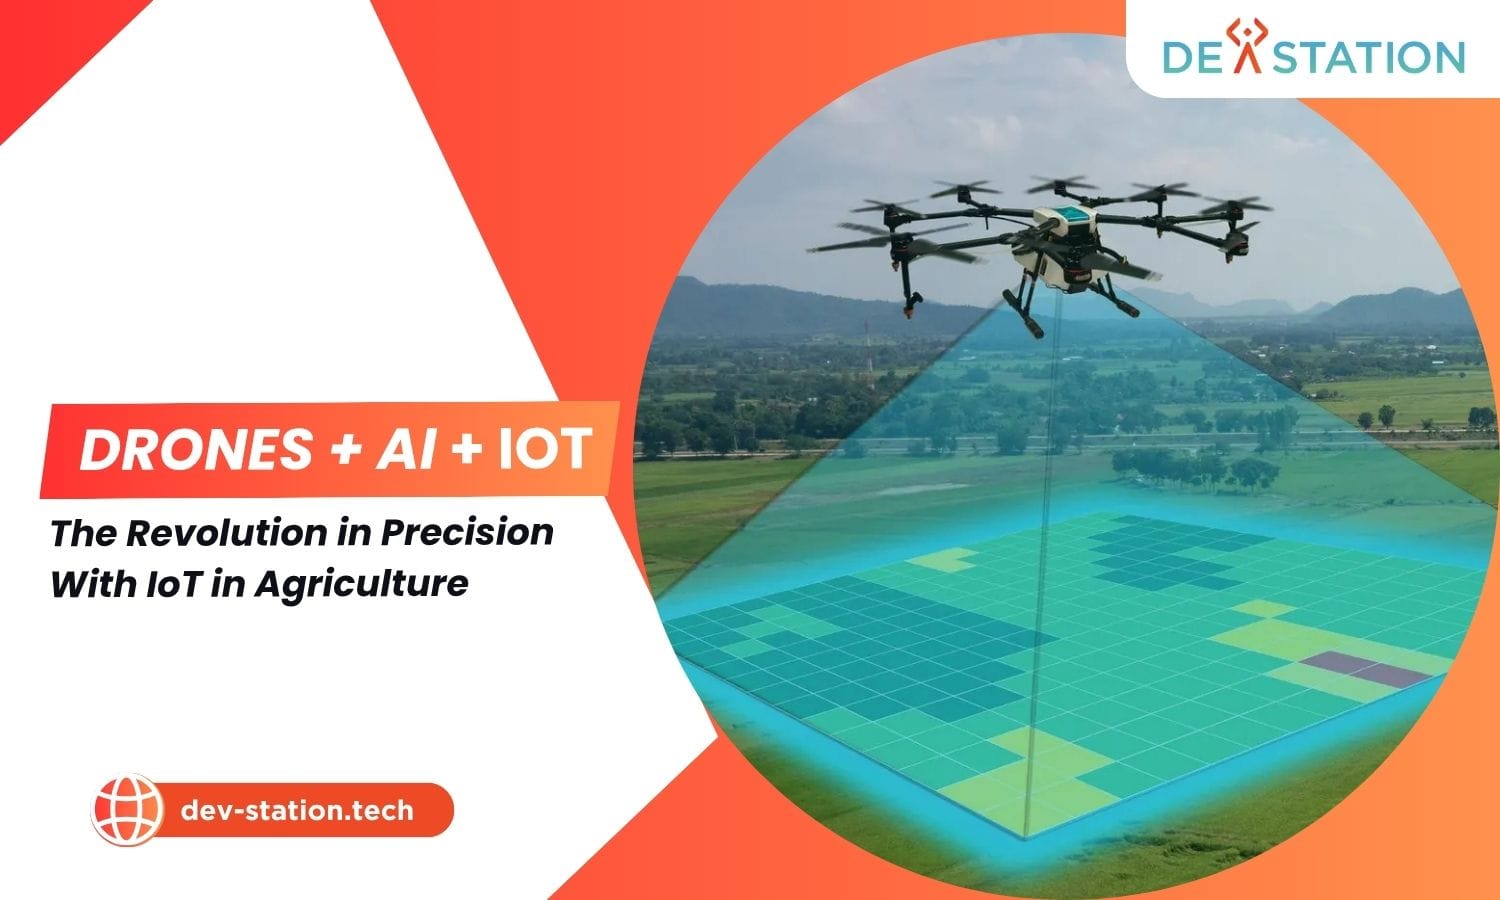
Key Takeaway, Drones + AI + IoT in Agriculture
Drones capture aerial imagery, IoT sensors collect ground-level data, and AI fuses both streams to enable real-time, precision decision-making across every acre. The result: 20 to 40% input savings, 15 to 30% yield gains, and farm-level ROI typically inside 12 to 24 months. Below: how the stack works, where it applies, the numbers that matter, the barriers to watch, and a concrete action plan.
Overview: Why Agriculture Needs All Three
For decades, farmers managed fields by the average, average soil, average weather, average pest pressure. But a 500-acre farm is not uniform. One corner sits in a low spot that floods after rain; another strip runs sandy and dries fast; a third block hides a nitrogen deficiency invisible until canopy close. Decisions made on averages guarantee over-application in some zones and under-application in others.
Three technologies, each powerful alone, converge to solve this:
Drones (UAVs)
Aerial data capture at sub-centimeter resolution. Multispectral and RGB sensors map crop health, biomass, and terrain, covering hundreds of acres per flight at a fraction of satellite revisit latency.
AI / Machine Learning
The brain. Computer vision models classify crop stress, weeds, and disease from drone imagery. Predictive analytics fuse sensor + weather data to prescribe variable-rate inputs zone-by-zone.
IoT Sensors
Ground truth. Soil moisture, temperature, pH, and weather stations stream continuous data. Livestock collars report location and vitals. The always-on nervous system drones can’t provide alone.
How Drones + AI + IoT Work Together
The system operates as a continuous four-stage loop. Each stage feeds the next, and AI sits at the center connecting them.
Sense, Drones + IoT Collect Data
Drones fly programmed transects capturing RGB, multispectral (NDVI), and thermal imagery. IoT soil probes, weather stations, and livestock collars stream telemetry over LoRaWAN/NB-IoT. Drone data is spatially rich but episodic; IoT data is temporally rich but point-based. Together they cover every dimension.
Fuse, AI Integrates the Streams
AI models orthomosaic-stitch drone imagery, then overlay IoT sensor point data. Computer vision detects anomalies (chlorosis, weed clusters, irrigation leaks). ML regressions correlate drone NDVI with soil moisture readings to interpolate ground conditions across the entire field, not just at sensor locations.
Decide, AI Generates Prescriptions
The fused data feeds decision engines that output zone-specific prescriptions: variable-rate nitrogen maps, spot-spray coordinates for weeds, irrigation schedules tuned to soil moisture deficits, and early-warning alerts for disease outbreak before visible symptoms spread.
Act, Automated + Human Execution
Prescription maps flow to GPS-guided sprayers, seeders, and irrigation controllers. Some actions are fully autonomous (turn on drip zone 3); others route to the farmer’s dashboard for approval. Drone re-flights verify treatment efficacy, closing the loop.
Applications: Where the Stack Delivers
| Application | Drone Role | IoT Role | AI Role | Impact |
|---|---|---|---|---|
| Crop Scouting & Stress Mapping | Multispectral NDVI flights identify stressed zones | Soil probes confirm moisture/nutrient cause | Vision models classify stress type (water, N, disease) | Scout 500 acres in 1 hour vs. 3 days on foot |
| Precision Spot-Spraying | RGB maps locate weed patches at cm resolution | Weather sensors confirm safe spray window | Object detection generates GPS weed coordinates | Reduce herbicide use 40 to 90% on treated fields |
| Variable-Rate Fertilization | Biomass maps reveal growth variability | Soil N/P/K sensors ground-truth nutrient levels | ML generates zone-by-zone prescription maps | 15 to 25% fertilizer reduction, yield maintained or up |
| Smart Irrigation | Thermal imaging detects water stress hotspots | In-ground moisture tensiometers stream live data | Predictive models schedule irrigation by deficit | 20 to 30% water savings, reduced pumping cost |
| Disease & Pest Early Warning | Hyperspectral sensors detect pre-visual infection | Insect traps with IoT counters track pest pressure | Time-series models forecast outbreak trajectory | Catch outbreaks 7 to 14 days before canopy spread |
| Livestock Monitoring | Thermal/aerial headcounts over pasture | GPS collars + rumen boluses track vitals 24/7 | Behavior models flag illness, estrus, or predation | Reduce mortality 10 to 20%, automate mustering |
| Yield Estimation & Insurance | Pre-harvest canopy mapping correlates to yield | Hopper sensors log actual yield at combine | Regression models refine yield predictions weekly | Accurate forecasts for logistics, contracts, claims |
Benefits: What Farmers Actually Gain
Environmental Sustainability
Less chemical runoff, lower carbon from reduced tractor passes, and water conservation. Precision agriculture directly supports regenerative goals and carbon-credit qualification.
Data-Driven Decision Making
Every season builds a historical dataset. Multi-year trends reveal which zones consistently underperform, enabling targeted soil remediation or variety selection instead of blanket guesses.
Operational Resilience
Early warning systems mean fewer catastrophic losses. Predictive pest and disease models let farmers act in the 7 to 14 day window before problems escalate, the difference between a spot treatment and a field-wide crisis.
ROI: The Numbers That Justify the Investment
| Investment Component | Typical Cost (Mid-Scale Farm) | Annual Benefit Driver | Payback Window |
|---|---|---|---|
| Multirotor drone + multispectral payload | $8,000 to $25,000 | Scouting labor, early detection savings | 1 to 2 seasons |
| IoT soil sensor network (20 to 50 nodes) | $5,000 to $15,000 | Water + fertilizer optimization | 1 to 2 seasons |
| AI software platform / subscription | $2,000 to $8,000/yr | Prescription maps, yield gains | Ongoing |
| Variable-rate controller retrofit | $10,000 to $30,000 | Input savings 20 to 40% | 2 to 3 seasons |
| Total System (200 to 1,000 ac) | $25,000 to $78,000 | Combined input + yield + labor | 12 to 24 months |
Challenges: What Can Go Wrong
Upfront Cost & Financing
Full-stack deployment runs $25K to $80K. Many farmers lack upfront capital or access to ag-tech financing. Leasing, co-ops, and service-provider models (drone-as-a-service) lower the barrier but shift costs to recurring fees.
Data Silos & Interoperability
Drone platforms, IoT vendors, and farm management software rarely speak the same protocol. Data gets trapped in proprietary dashboards. API fragmentation is the #1 integration headache. Farmers end up with 5 apps and no single source of truth.
Connectivity in Rural Areas
IoT sensors need networks; many fields have no cellular coverage. LoRaWAN gateways and satellite backhaul solve this but add cost and complexity. Drone data transfer also needs bandwidth. A single multispectral flight can generate 2 to 5 GB.
Skill Gap & Change Management
Farmers are agronomists, not data scientists. Interpreting NDVI maps, calibrating prescription models, and maintaining IoT hardware require new skills. Without training and intuitive UIs, expensive tech sits unused after season one.
Regulatory & Privacy
Drone flight regulations (Part 107 in the US, EASA in EU) restrict altitude, night ops, and BVLOS. Some regions require licenses. Data privacy concerns arise when imaging neighboring properties or livestock operations. The data pipeline usually hits its own limit before the regulation does, which is the argument in our note on drone inspection data and BVLOS.
Model Accuracy & Trust
AI prescriptions are only as good as training data. Models trained on one crop/region may underperform elsewhere. Farmers who act on a bad prescription lose a season. Building trust requires side-by-side validation strips and transparent confidence scores.
Action Plan: How to Get Started
Assess & Pilot (Month 1 to 3)
Identify your highest-value or most variable fields. Start with a drone-as-a-service provider ($5 to $15/acre) to fly multispectral maps, no capital required. Install 5 to 10 IoT soil moisture sensors in representative zones. Use the data to establish a baseline and see the variability before investing in hardware.
Choose an Integrated Platform (Month 3 to 4)
Select an AI + farm management platform that ingests both drone imagery and IoT sensor data. Prioritize open APIs and compatibility with your existing equipment. Avoid vendor lock-in. If data can’t export, walk away.
Scale Hardware (Season 2)
Based on pilot results, invest in your own drone + sensor network if ROI is proven. Retrofit variable-rate controllers on key equipment. Expand IoT node coverage. Train at least one team member on the platform, budget 20 to 40 hours.
Optimize & Automate (Season 3+)
Now you have 2+ seasons of historical data. AI models improve with more data. Begin automating prescriptions, irrigation triggers, spot-spray missions. Add livestock monitoring if applicable. Reinvest savings into expanding coverage to the whole operation.
Dev Station works with teams across the United States and the United Kingdom. Device and telemetry data stays in your own cloud tenant, in the region your policy requires. Where a client needs SOC 2, HIPAA or UK GDPR evidence, we build the technical controls those frameworks ask for and work alongside the assessor who issues the certificate. Our engineers work from Vietnam with overlap into US Eastern, US Pacific and UK GMT hours, and we invoice in USD or GBP.
Want an AI assistant to summarize or cite this guide?
Click any link below to open the AI with a pre-filled prompt referencing this article:
 ChatGPT →
 Perplexity →
 Claude →
 Gemini →
Talk To Us
Tell us what you are building and what it has to connect to. An engineer answers, and you get a straight view of what the work would take.
Get In Touch →