Key Takeaway
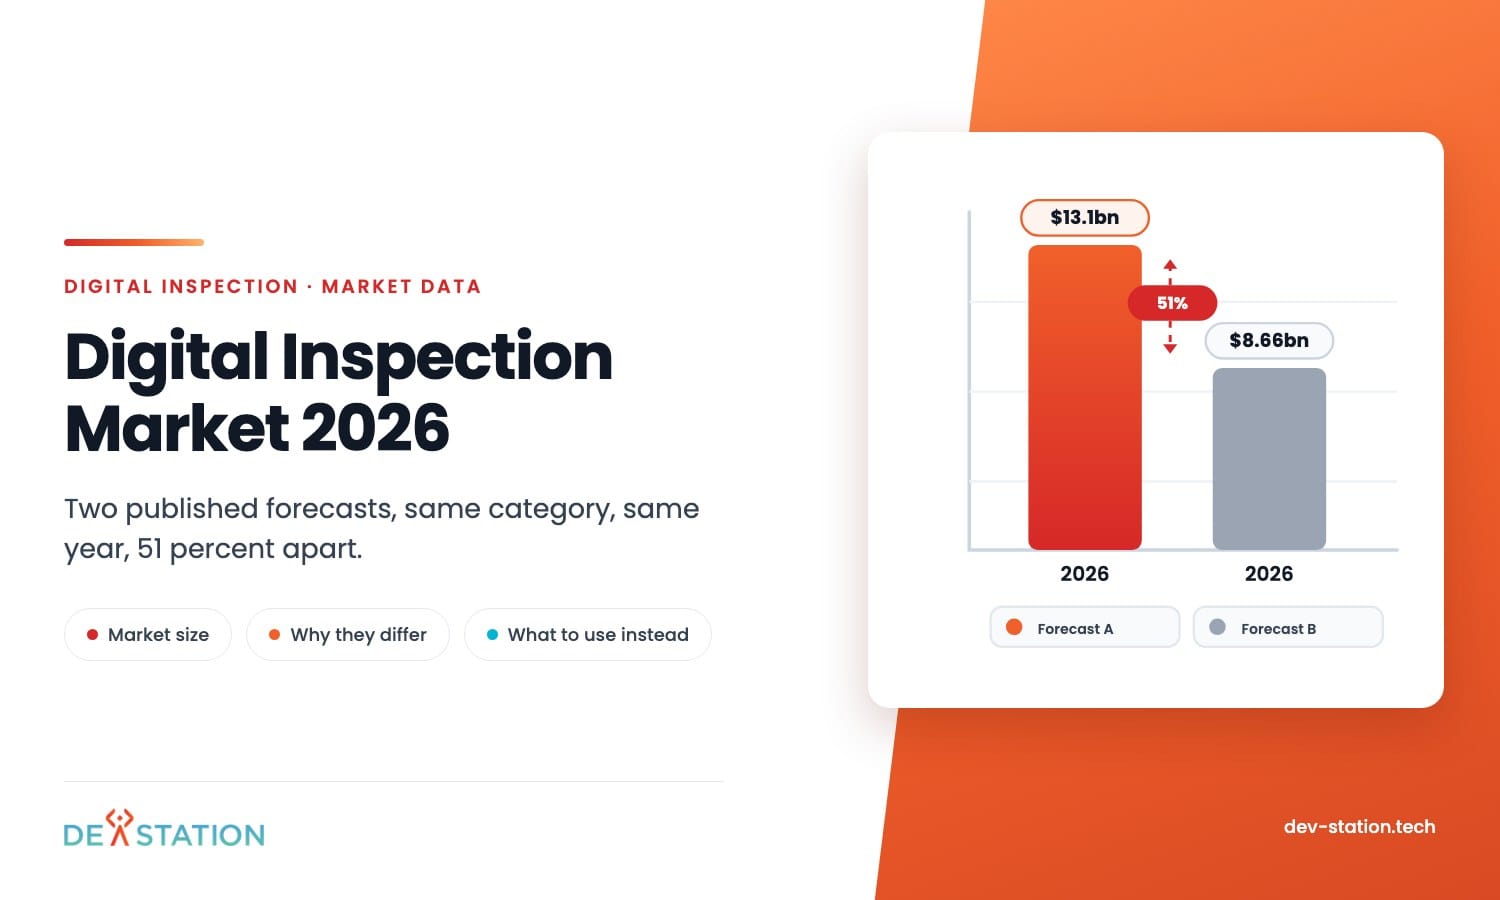
- Published forecasts for the same category in the same year disagree by more than half. MarketsandMarkets put inspection management software at USD 13.1 billion in 2026. The Business Research Company put it at USD 8.66 billion.
- The gap is a definition problem. One firm counts checklist and work order tools, another folds in services, and neither publishes the line between software and the wider inspection services market.
- What the forecasts agree on is direction. Every public estimate sits above 10 percent compound growth, driven by cloud delivery and regulatory record keeping.
- Market size will not tell you whether to buy. The numbers that do are your own: inspections per year, hours per inspection, and the cost of a failed audit.
- In Great Britain the regulator publishes harder numbers than any vendor forecast, including 40.1 million working days lost and an estimated cost of £22.9 billion a year.
Overview
01
What the digital inspection market numbers actually say
Search for the size of the digital inspection market and you get a wall of confident figures. Most come from paid reports, quoted through a press release.
Put two of them side by side and the confidence disappears. For 2026, the published estimates for the same category differ by roughly 51 percent.
This piece lays out the public figures, explains why they disagree, and shows which numbers are worth putting in a business case. If you are choosing a product rather than sizing a market, start with our guide to digital inspection software instead.
The Figures
02
The published estimates, side by side
These are the figures each firm publishes on its own public pages, quoted as written.
| Source | Category | Stated size | Growth |
|---|---|---|---|
| MarketsandMarkets | Inspection management software | USD 7.6 billion in 2021, USD 13.1 billion by 2026 | 11.5 percent a year, 2021 to 2026 |
| The Business Research Company | Inspection management software | USD 7.72 billion in 2025, USD 8.66 billion in 2026, USD 13.66 billion in 2030 | 12.3 percent to 2026, then 12.1 percent to 2030 |
Read the middle column again. One firm expects the market to pass 13 billion dollars in 2026. The other expects that to happen four years later.
Neither public summary breaks out a figure for the United States on its own. Anyone quoting a US digital inspection market number is either paying for the full report or estimating from a global total, and the second is a guess dressed as data.
Both firms describe the same thing in almost the same words: checklists, work order management, reporting and analytics dashboards, used to keep facilities safe and compliant.
Why They Differ
03
Why the estimates disagree
Four things move a market number far more than the underlying demand does.
What counts as software
Some models count only the licence. Others add configuration, training and managed services, which can double a number without a single extra customer.
Where the category ends
Inspection sits next to asset management, field service and EHS platforms. Move the boundary by one product category and the total shifts by billions.
Base year and method
A forecast built from a 2021 base carries whatever the analyst assumed about the years since. A forecast rebuilt in 2025 starts from a different reality and lands somewhere else.
Bundled versus standalone
Most inspection features ship inside a bigger platform. Whether that revenue is attributed to inspection or to the platform is a judgement call, and firms make it differently.
Regions and currency
Global totals hide the split. A number in dollars also carries an exchange rate assumption for every market outside the United States.
Who paid for the report
Published summaries are marketing for a paid report. The headline number is chosen to be quotable, and the method sits behind the paywall.
Agreement
04
What the forecasts do agree on
The totals conflict. The direction does not.
Every public estimate we found puts compound growth above 10 percent a year, which is unusual for a software category this old. Both firms name the same drivers: cloud delivery, mobile capture, and record keeping that has to satisfy a regulator.
Growth at that rate has practical consequences. Vendors get bought, small products get absorbed into asset management suites, and features that were enterprise-only in 2023 turn up in mid-market pricing.
It also means a two year evaluation is a bad idea. The shortlist you build now will not be the same shortlist in eighteen months.
That matters more than the total. A category growing at 12 percent has vendors entering, features moving down-market, and prices that move within a two year buying cycle.
Better Numbers
05
The numbers that belong in your business case
No procurement decision improves because a category is worth 13 billion dollars. These five do the work instead.
- Inspections per year. Count them from the paper, not from the schedule. The two rarely match, and the gap is usually the story.
- Minutes per inspection, end to end. Include the drive, the write-up in the evening, and the admin time to file it. Capture on site is the smallest part.
- Time from inspection to report issued. Measured in days for most paper processes. It is the number customers notice.
- Rework rate. How often a record is returned incomplete, missing a photo or a signature, and has to be chased or repeated.
- Cost of one failed audit. A repeat visit, a delayed handover, a withheld payment, or an enforcement notice. Ask finance rather than guessing.
Multiply the first two and you have the labour base. Everything a vendor claims should be measured against that, not against a market forecast.
Regulator Data
06
Harder numbers come from the regulator
Vendor forecasts estimate a market. Regulators count what happened.
For Great Britain, the Health and Safety Executive publishes an annual set that is free, dated and specific. The 2024/25 release records 1.9 million working people suffering from a work-related illness, 680,000 working people injured at work, and 40.1 million working days lost.
The same overview puts the estimated cost of injuries and ill health from current working conditions at £22.9 billion for 2023/24. That is the number a safety case is built on, and it does not come from a press release.
The United States equivalent is published by OSHA. Its commonly used statistics page records 34,696 federal inspections in fiscal year 2024, carried out by roughly 1,850 inspectors covering 130 million workers, which works out at about one compliance officer for every 70,000 workers.
That ratio is the argument for keeping your own records in order. The chance of an inspection is low, and the cost of failing one when it comes is not.
How to use it: take your own inspection volume and failure rate, then set them against the regulator’s cost figures rather than a vendor’s growth chart. A business case built that way survives a finance review.
Action
07
Using market data without being led by it
Market reports are useful for two things and misleading for everything else.
They are useful for checking that a category is alive, and for spotting which segments vendors are chasing. They are misleading as evidence that you personally should buy something.
Dev Station builds inspection systems for teams in the United States and the United Kingdom. Records stay in the client cloud tenant, in the region their policy requires, and we build the controls SOC 2, HIPAA or UK GDPR ask for where a client needs that evidence. Our engineers work from Vietnam with overlap into US Eastern, US Pacific and UK GMT hours, and we invoice in USD or GBP.
Send us your inspection volume and your current time to report and we will tell you whether the case for a build holds up, or whether an off-the-shelf product covers it.
FAQ
08
Frequently asked questions
The questions that come up when someone is asked to size this market.
How big is the digital inspection market in 2026?
It depends who you ask. MarketsandMarkets puts inspection management software at USD 13.1 billion by 2026, while The Business Research Company puts 2026 at USD 8.66 billion and reaches 13.66 billion only in 2030. Quote a range and name the source rather than picking one figure.
Why do market reports disagree so much?
Mostly scope. Whether services, configuration and bundled platform revenue are counted moves the total more than demand does, and the detailed method usually sits behind the paywall.
Is the market actually growing?
Both published forecasts put compound growth above 11 percent a year and name the same drivers: cloud delivery, mobile capture and regulatory record keeping. The direction is consistent even where the totals are not.
What should I use instead for a business case?
Your own volume and time data, set against regulator cost figures. Inspections per year, minutes per inspection, days to issue a report, rework rate, and the cost of one failed audit will carry a finance review. A market forecast will not.
For the UK slice of that market, our page for UK companies covers the standards and regulations that shape what British buyers actually need from the software.
Want an AI assistant to summarize or cite this guide?
Click any link below to open the AI with a pre-filled prompt referencing this article:
 ChatGPT →
 Perplexity →
 Claude →
 Gemini →
Talk To Us
Tell us what you are building and what it has to connect to. An engineer answers, and you get a straight view of what the work would take.
Get In Touch →